Baseball Forecaster
How the Baseball Forecaster Happened
(Excerpt from Fantasy Expert, Chapter 5)
I was not a very good fantasy player in the early going, but I was convinced there had to be a way to win this game. Did I have to get a better handle on the player pool? Did I need to be willing to spend more for players? Or did I need to make better trades?
There were three books that had captured my attention… the Bill James Abstract, The Hidden Game of Baseball and How Life Imitates the World Series. I was convinced that the answer to winning this Rotisserie thing was hidden somewhere inside those three books. But Bill James, Pete Palmer and Thomas Boswell all used different metrics to evaluate talent. Which one was best – runs created, linear weights or total average? I thought it would be valuable to see all the players listed with those three “new statistics” presented side-by-side-by-side. I could put together a spreadsheet like that. Hmm.
I figured that if I spent the time to do that, maybe others would find it of value as well. What the heck, I’ll just write a book. How hard could it be? I had worked for several publishing companies. I had learned how to do direct marketing. I was a good writer and a magician with LOTUS 1-2-3. And I was a control freak.
Piece of cake.
Nearly four decades later…
Baseball Forecaster
The Complete Library
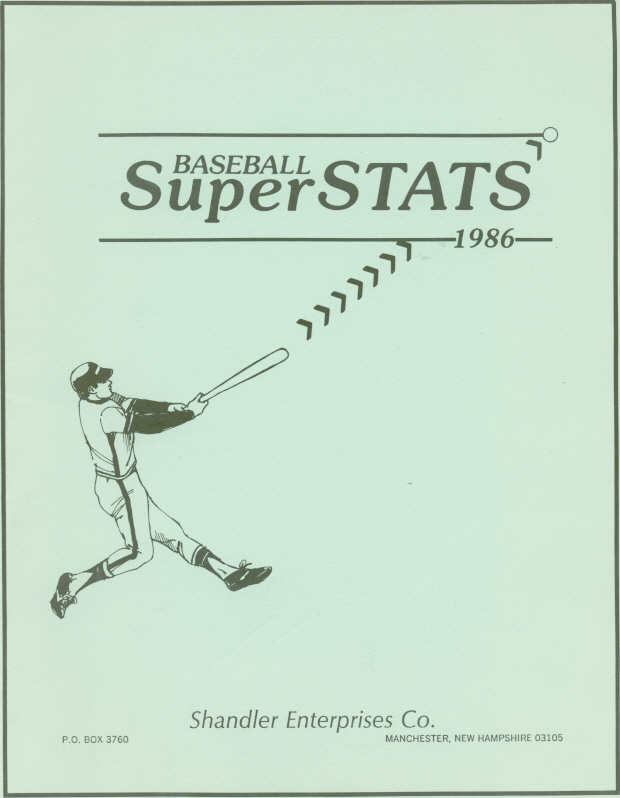
1986
Reports for all 26 teams, each listing the top 30 players. First publication of gauges from Bill James, Pete Palmer and Thomas Boswell, all in one place. Included secondary average, total average, linear weights, runs created, plus pitching effectiveness (forerunner of strand rate) and more.
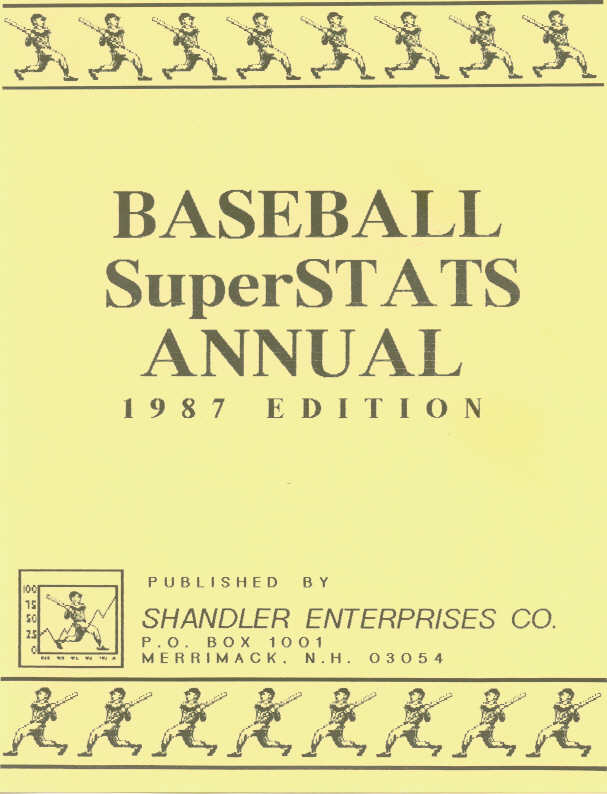
1987
New: Offensive winning pct., defensive differential, baserunners prevented avg., earned runs prevented avg (next iteration of strand rate) and total pitching effectiveness.
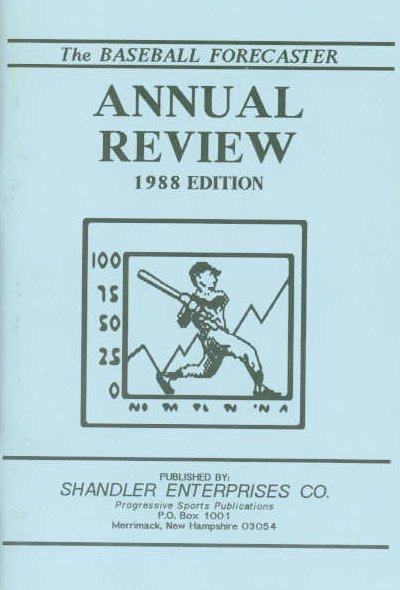
1988
New: Expanded format, situational team records, monthly and 10-year performance trends, monthly Pythagorean projections, draft guide history (including the first player projections, for linear weights and Rotisserie ratings)
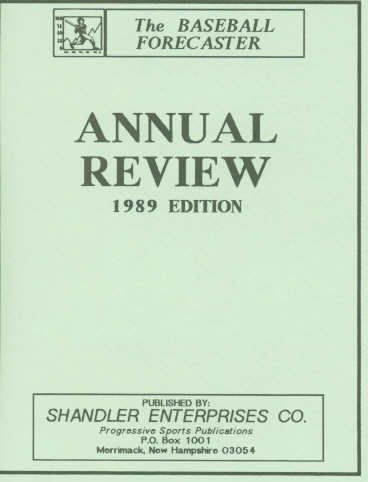
1989
New: xERA, team projections using Jamesian tools like the Johnson Effect.
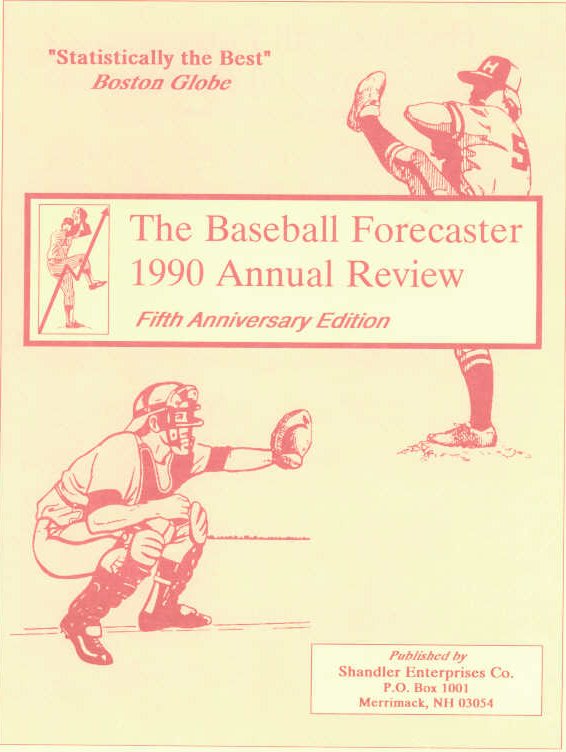
1990
Long Ago in a Galaxy Far, Far Away
New: Expanded format, debut of the first individual player boxes. Boxes listed monthly stats in one section, 5-year stats in another, plus a 2-line commentary.
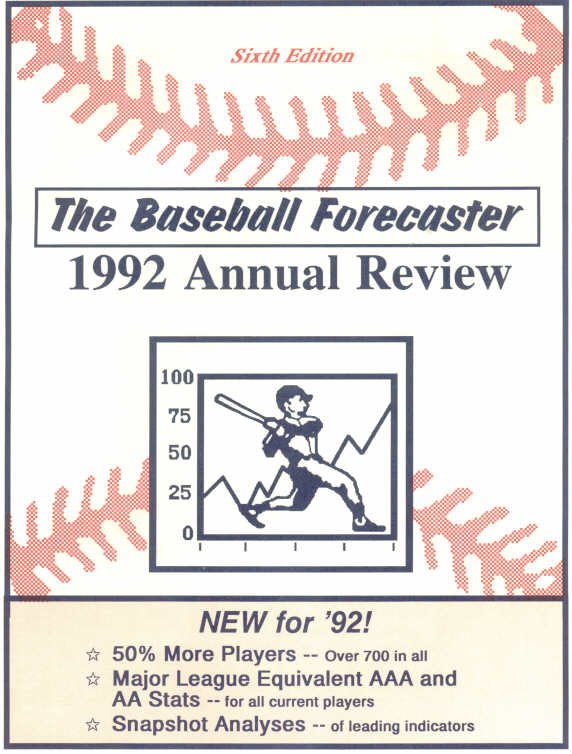
1992
Decomposing Idols and Near Sleep
New: Post-dating of editions begins, over 50% more players, revised player box format (including snapshot analysis section), major league equivalents, full stat projections, stolen base opportunity pct. and expected linear weights.
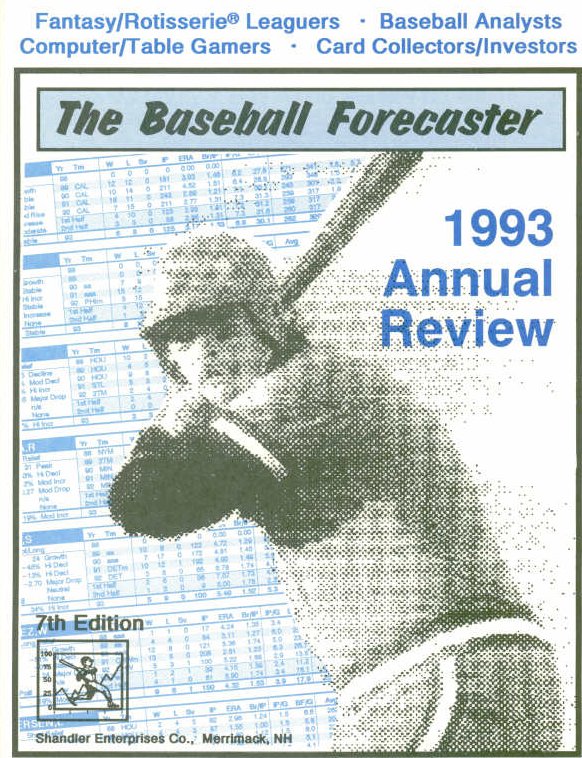
1993
Cocktails
New: Pure Pitching Potential (forerunner of BPV), more analytical essays (on predictability, forecast construction, leading indicators), burnout potential
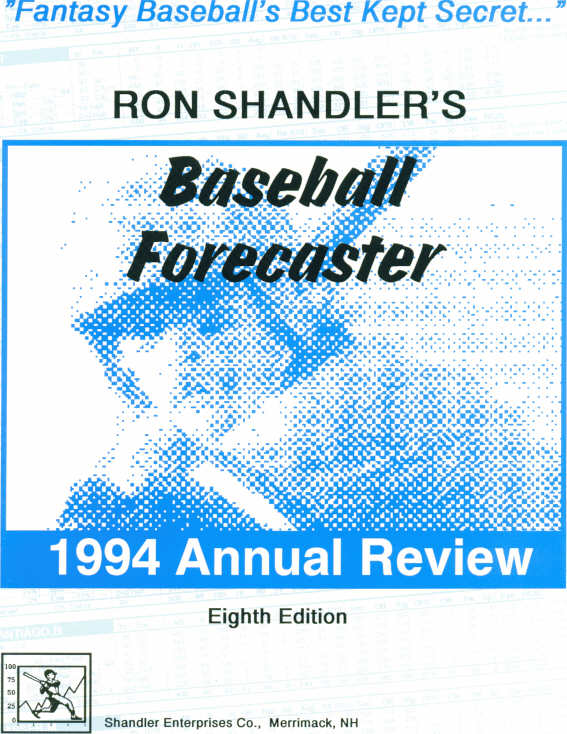
1994
Harsh Realities
New: Full player commentary boxes, power and speed ratings, glossary
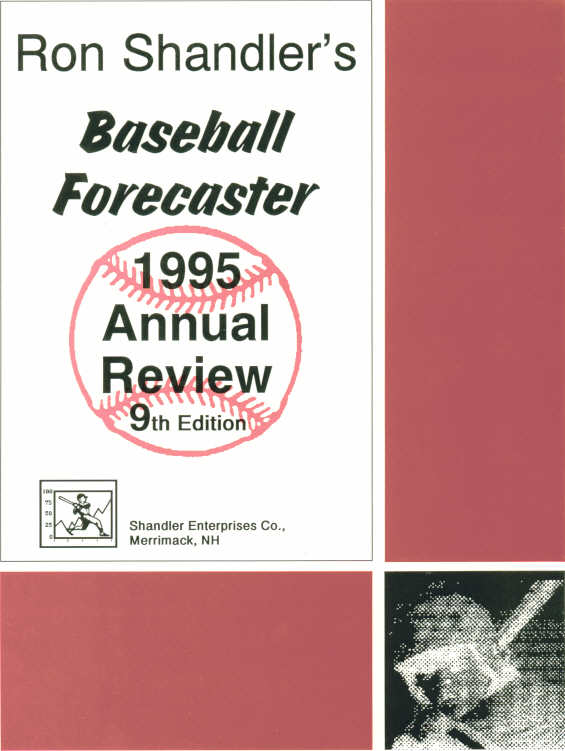
1995
Canned Philosophies
Published during the baseball strike. New: Forecast risk, strand rate
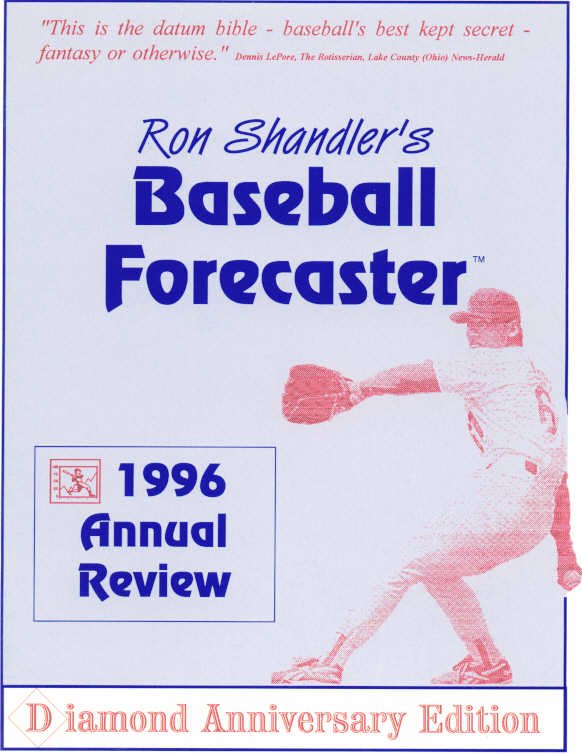
1996
Not all bad things happen in Pittsburgh
New: Normalized gauges, glossary expanded and redesigned into an encyclopedia
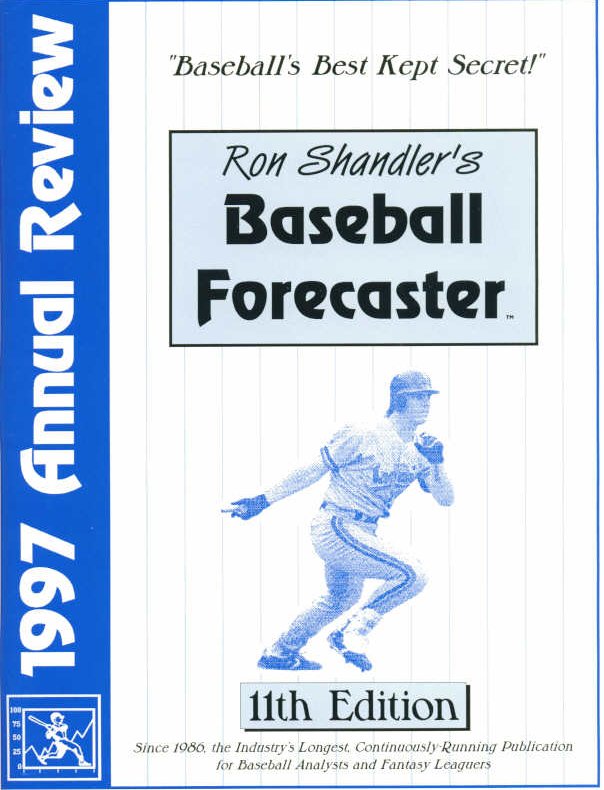
1997
Hillbillies
New: Minor league prospect analysis, base performance value (BPV)
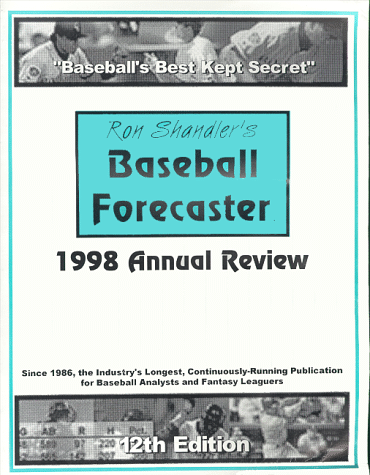
1998
The Ancient Legend of TOG
No significant changes.
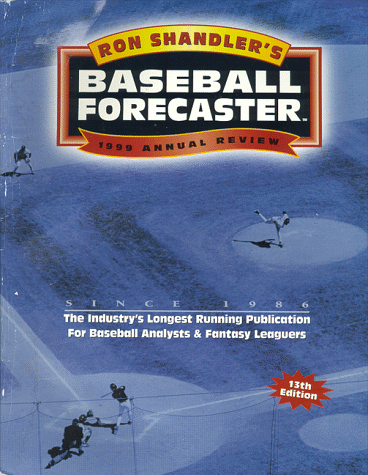
1999
Crickets
New: Runs above replacement, 2-year major league equivalent stats for all AA and AAA players
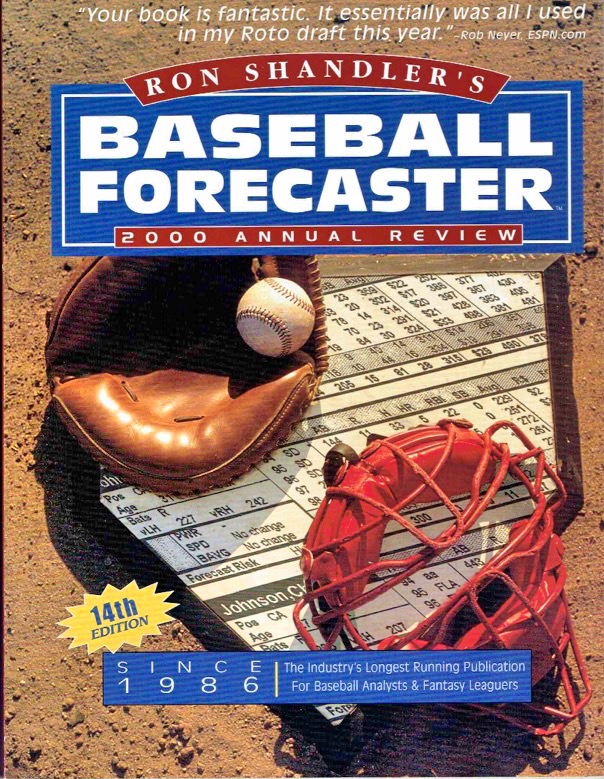
2000
Revelation
New: Injury updates, Low Investment Mound Aces (LIMA) Plan
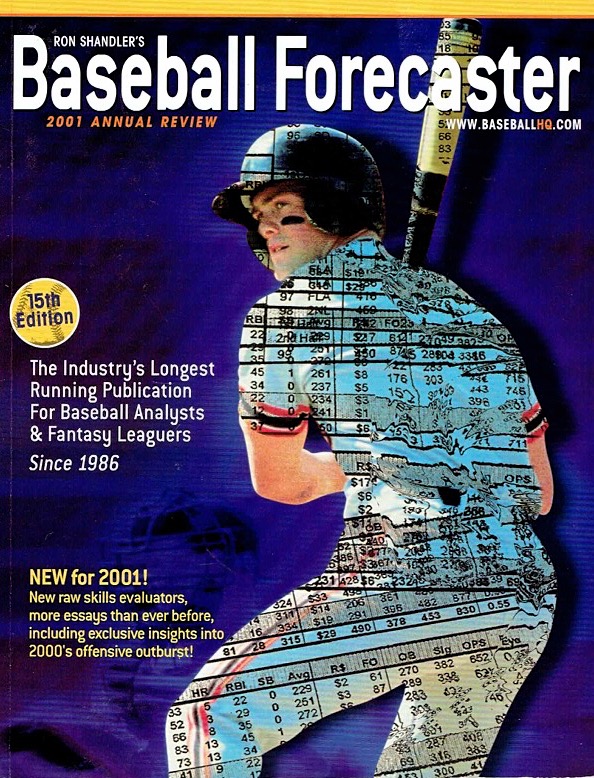
2001
Propaganda
New: Walk rate, contact rate, expanded prospect summaries, Baseball HQ essay archive
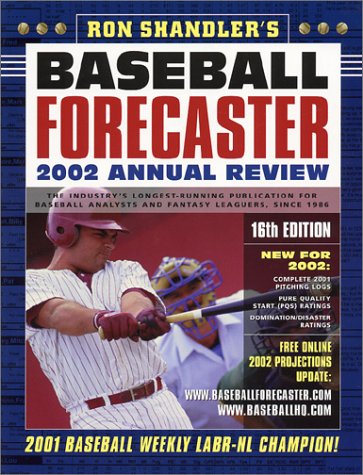
2002
Catharsis
New: Pitching logs, Pure Quality Start (PQS) ratings, Domination/Disaster Pcts, full forecast boxes for top prospects, hit pct (H%) for pitchers, Cheater’s Bookmark.
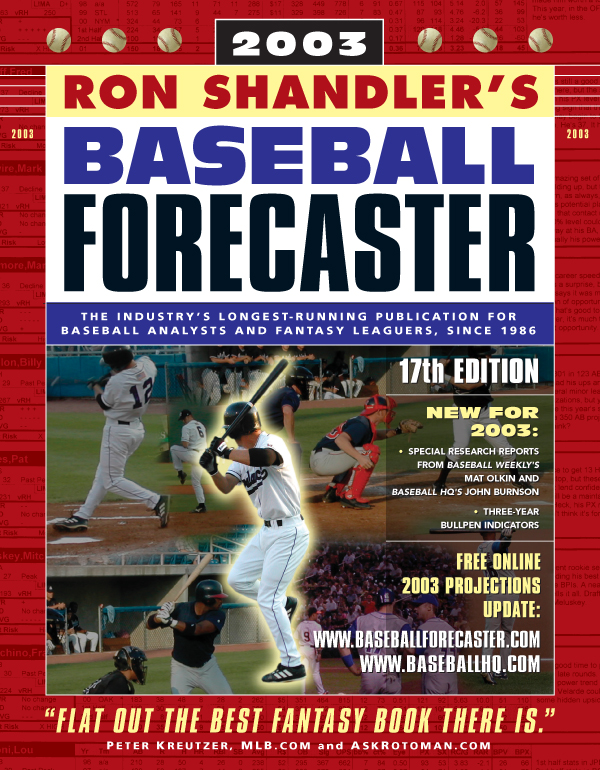
2003
Pilgrimage
New: Bullpen indicator charts, ground ball/flyball ratios, expected batting average, 5-year platoon data, pitching run support
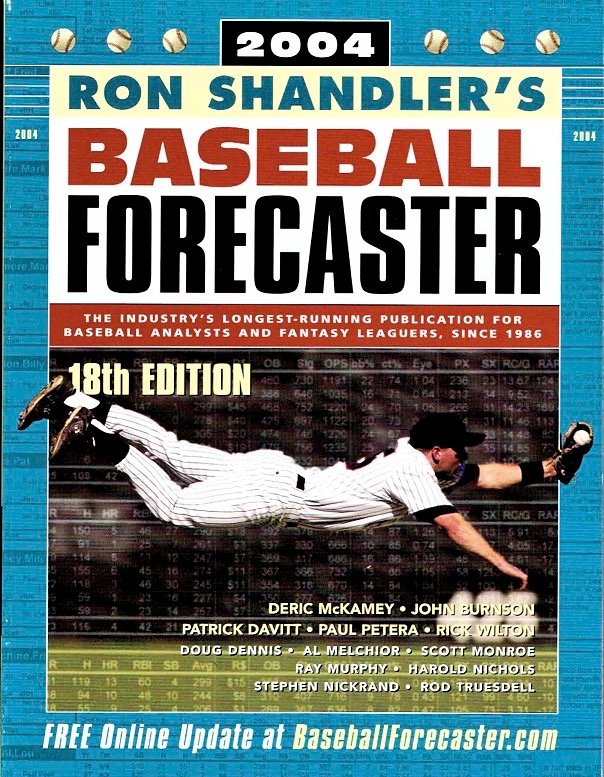
2004
Fanalytics
New: Batting hit rates, risk table, ERA/batting average percentage plays, closer volatility analysis
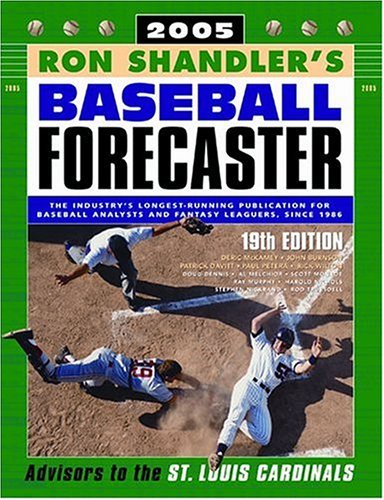
2005
Relevance
Advisors to the St. Louis Cardinals.
New: Reliability scores, DL days, ball-in-play rates, 5×5 values, new sections for Fanalytics and Gaming, redesigned draft guides
2006
Longevity
20th Anniversary Edition
New: Team section, 5-year DL history, stolen base opportunity pct., HR/FB rates
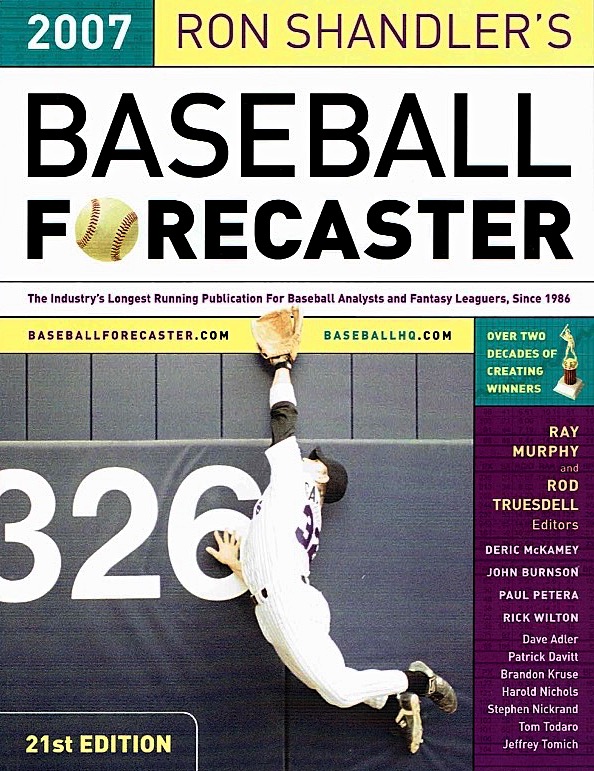
2007
WATCH
New: Expected HRs, league base performance indicators, gaming research, updated formulas, more ranking lists
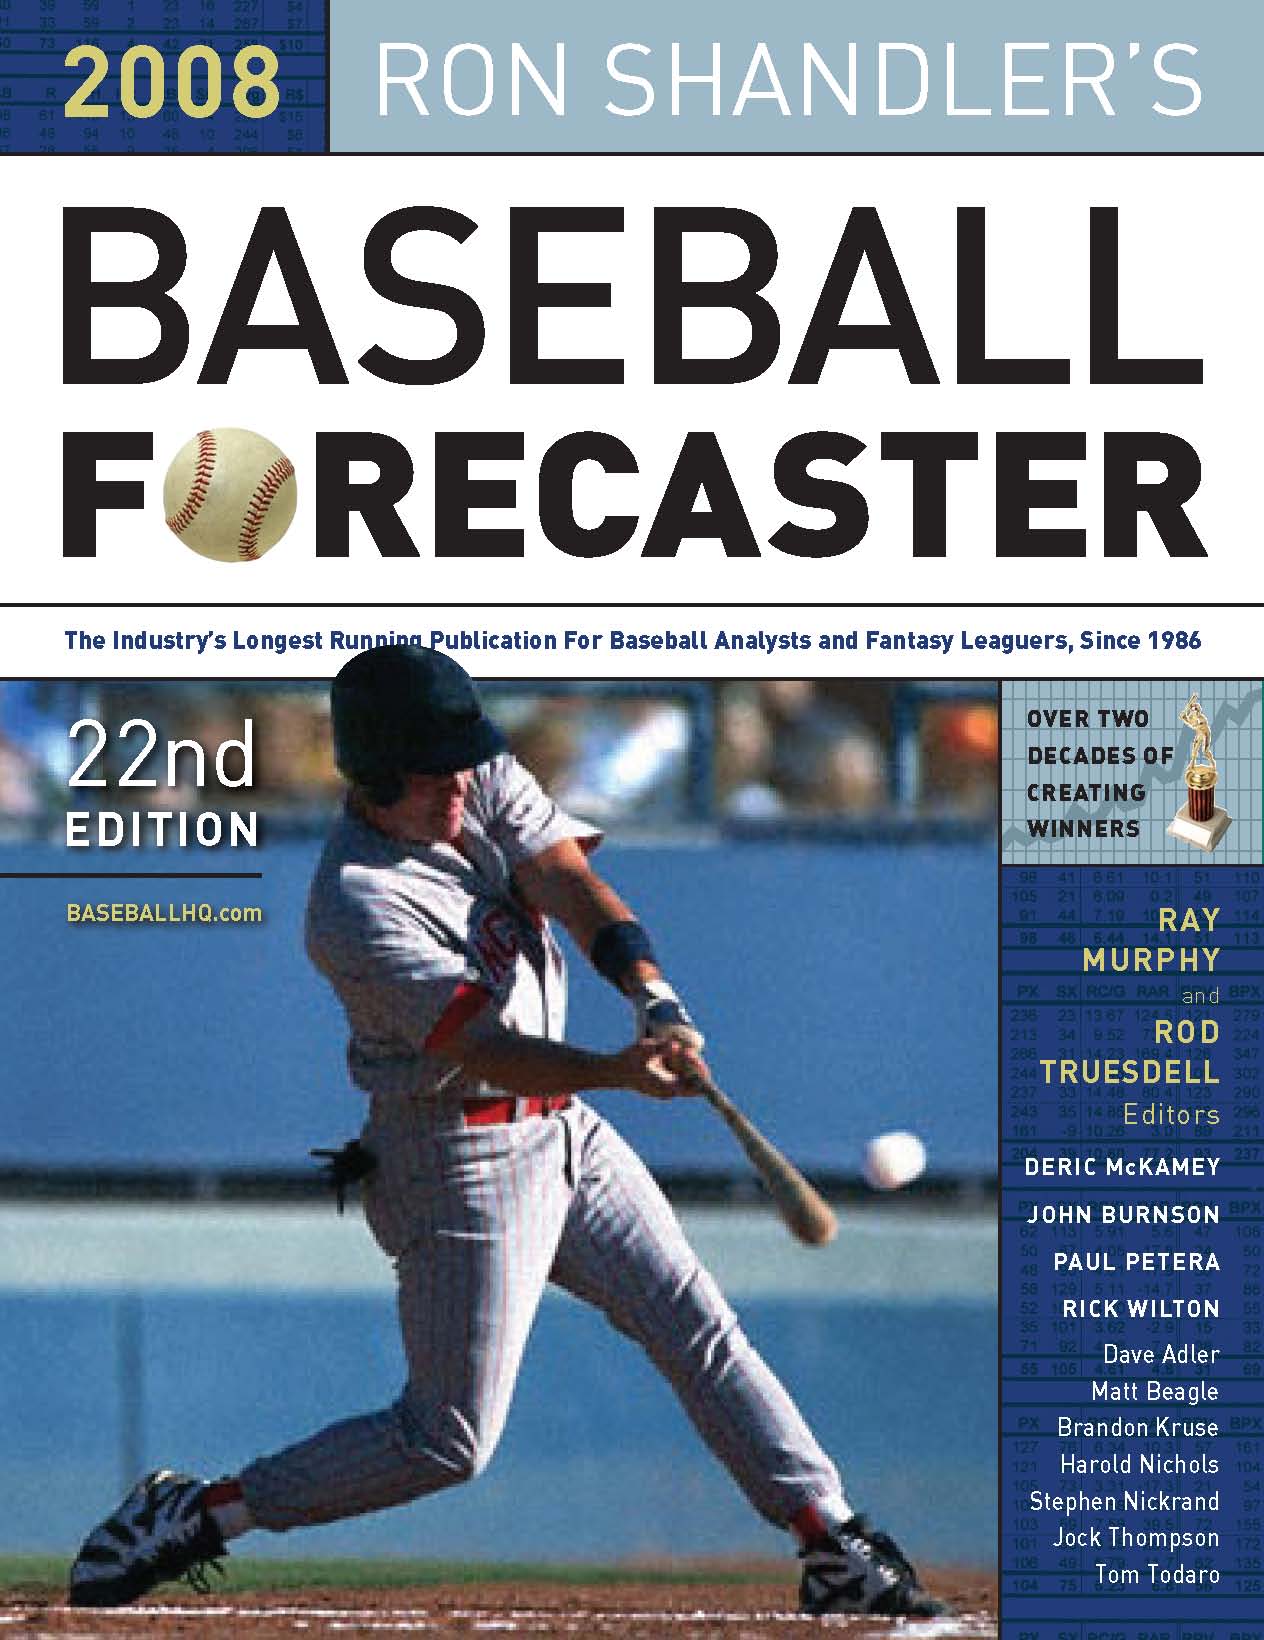
2008
Noise
New: Expanded injury section, Japanese League coverage, breakout/breakdown scores
2009
Faith
New: More players, consistency charts, reliability grades
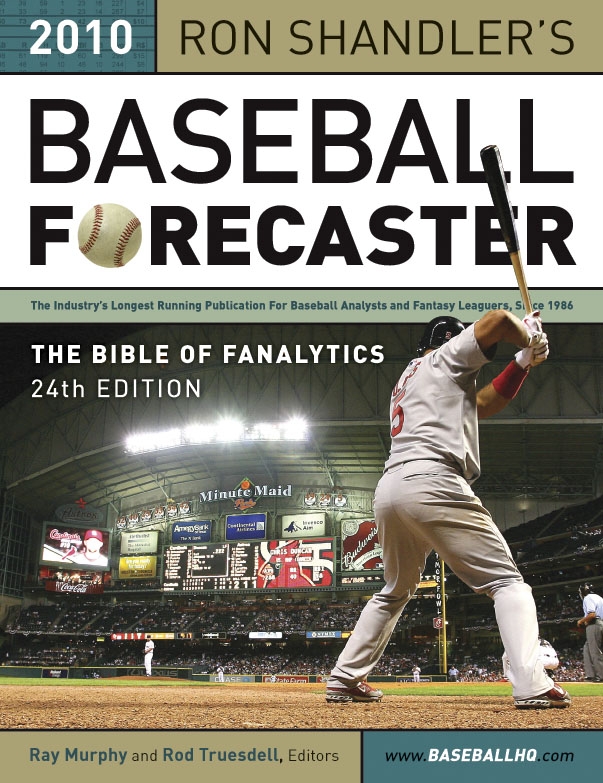
2010
Billboards
New: Mayberry Method, More years of data, batter BPV values, hidden contests and surveys
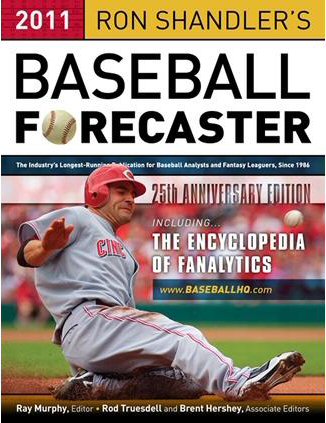
2011
Now
25th Anniversary Edition
New: Rotisserie 500, power and speed support charts
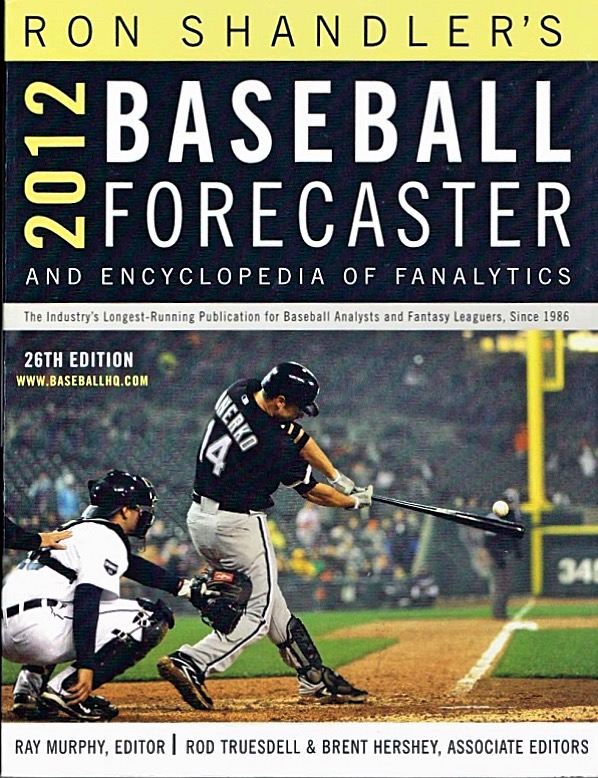
2012
Simulators
New: Expanded player boxes, expanded prospect section, universal draft grid
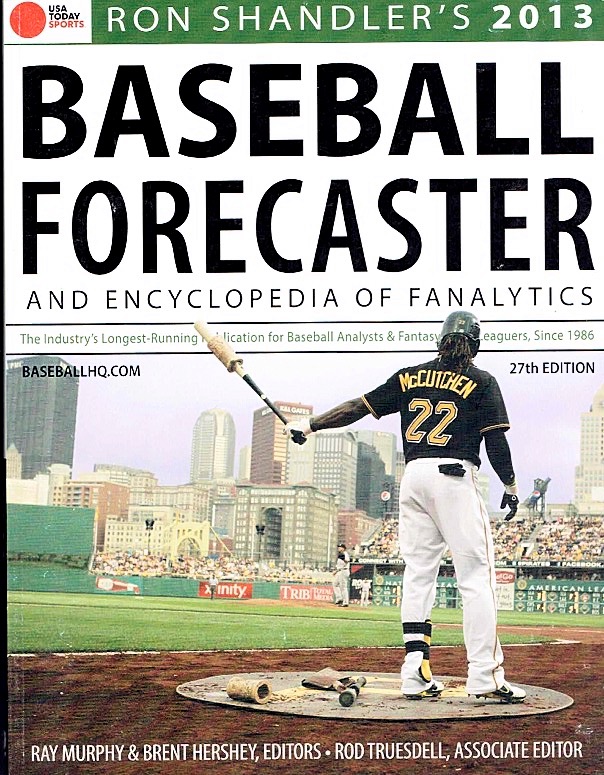
2013
Gravity
New: LIMA benchmarks, Mayberry Method 3.0
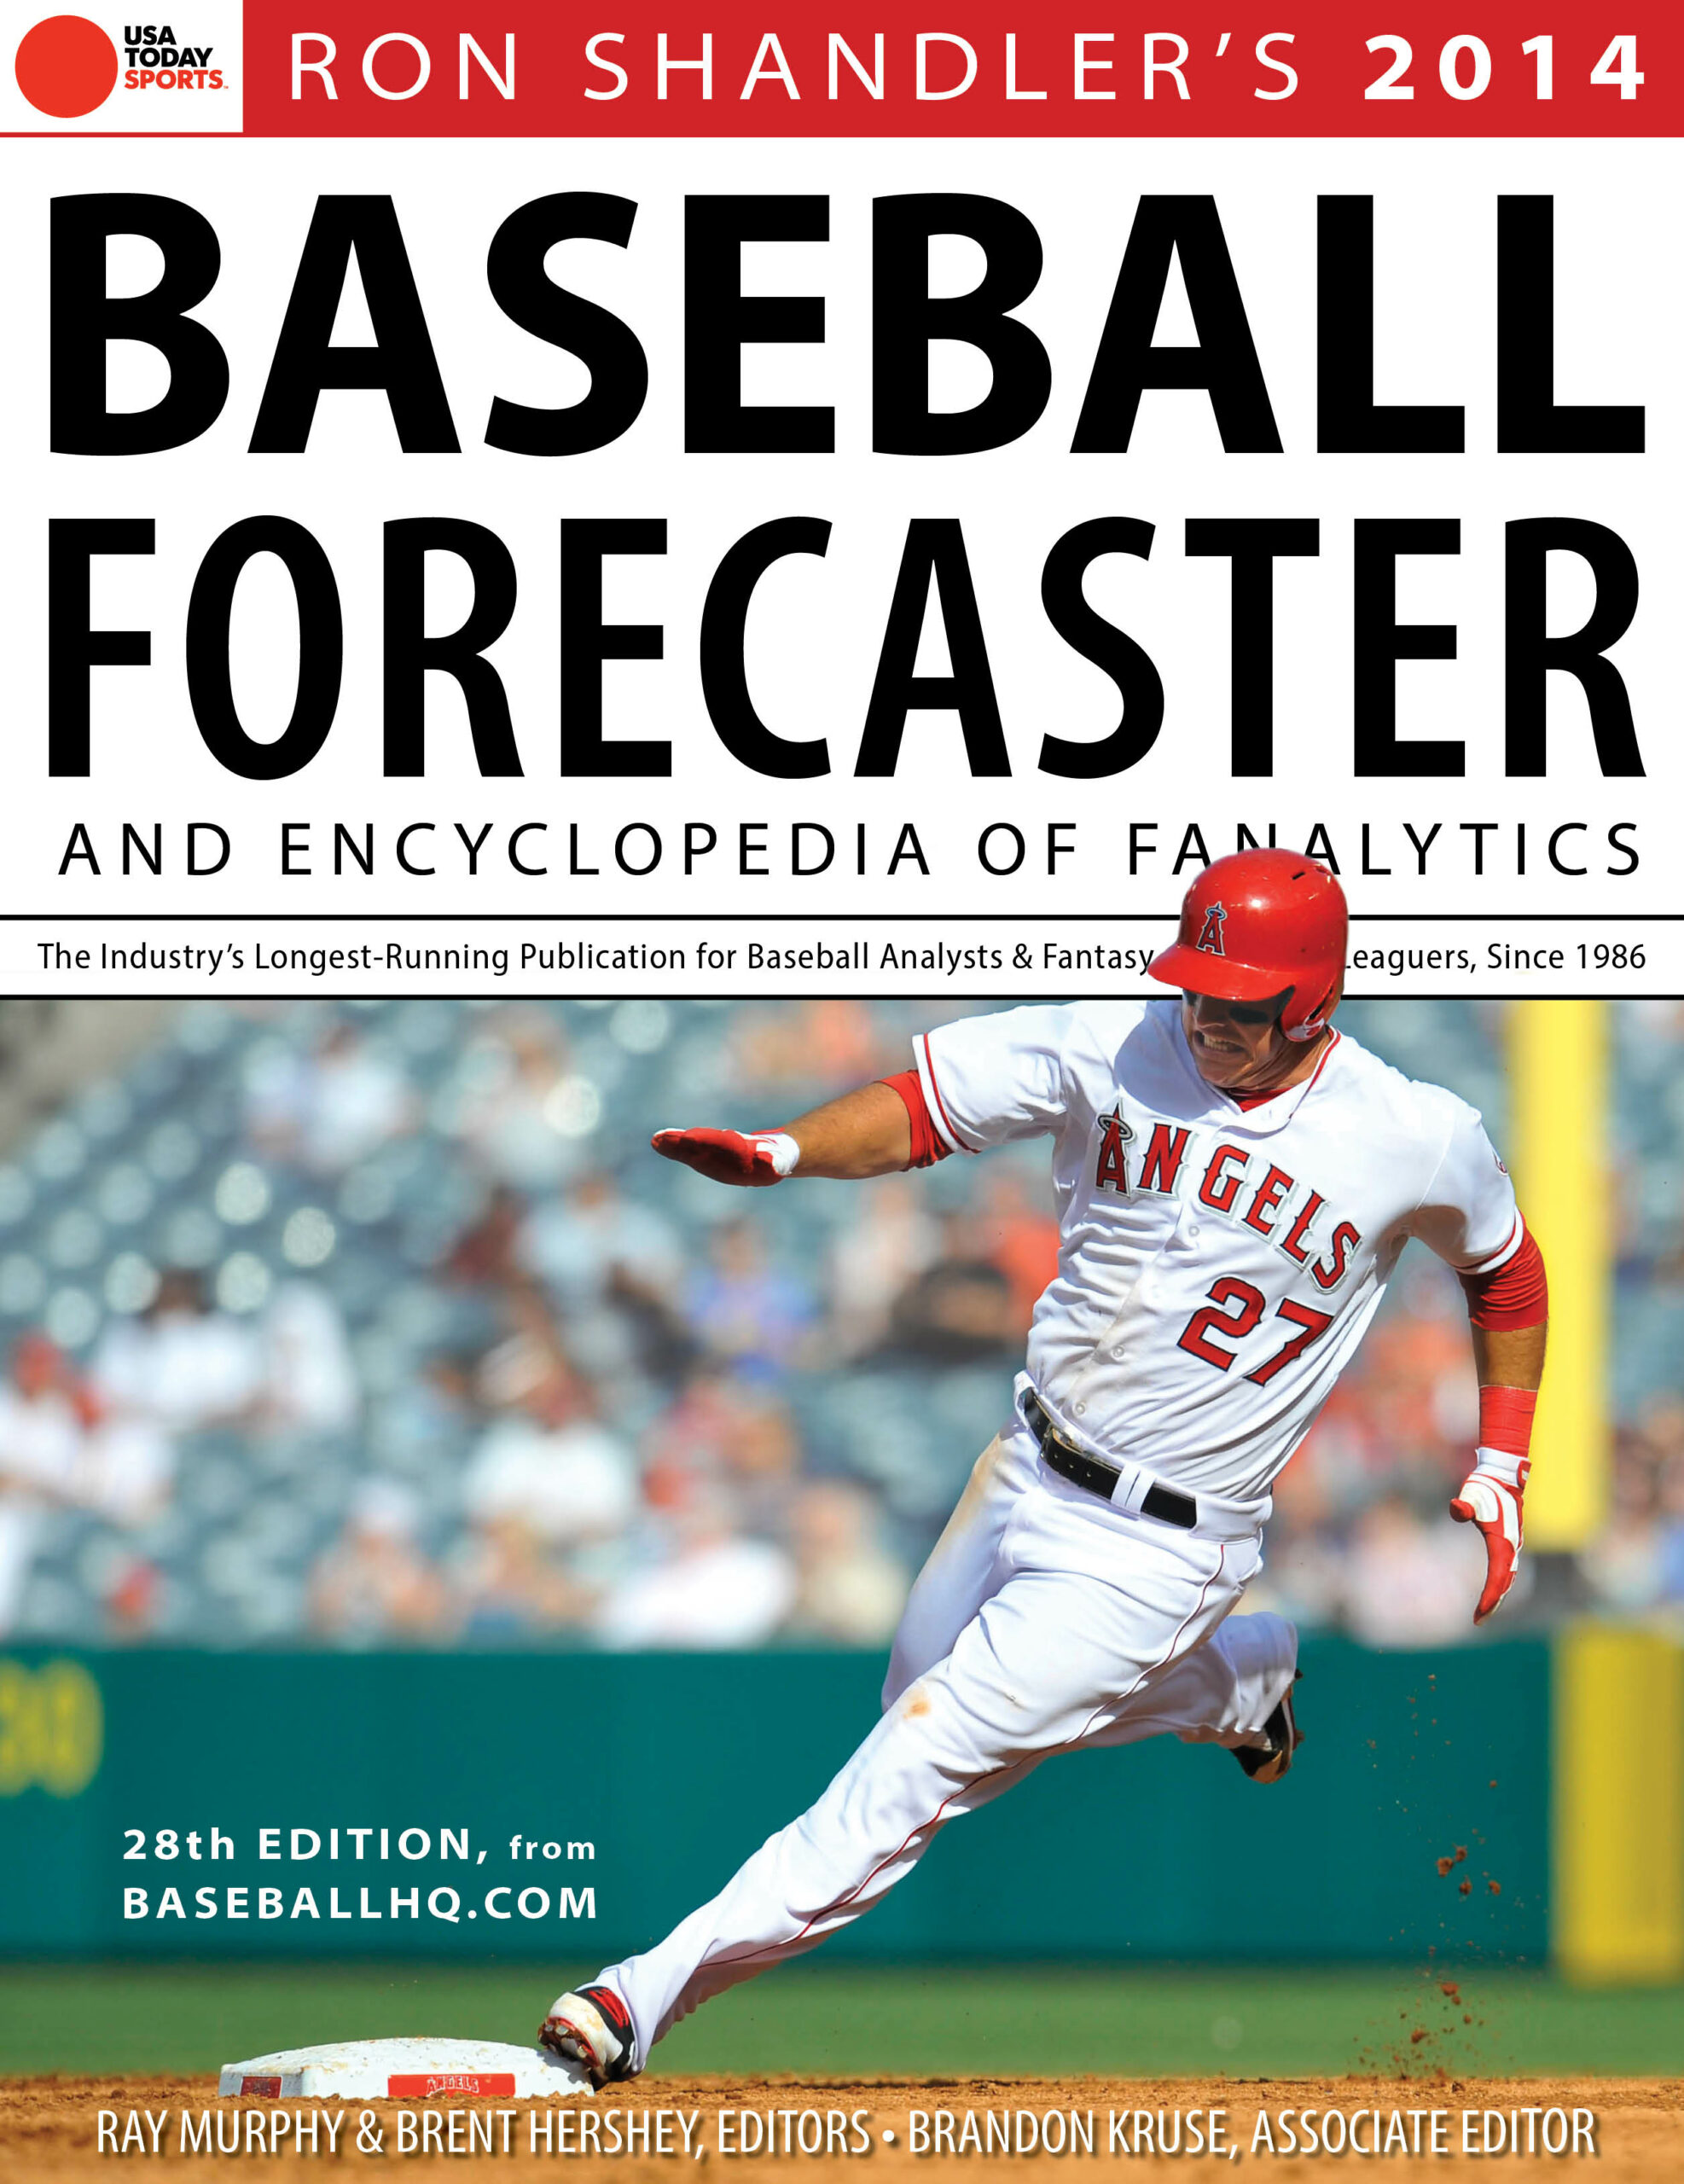
2014
Nightmare
New: Swinging strike rate, better platoon split data, updated formulas.
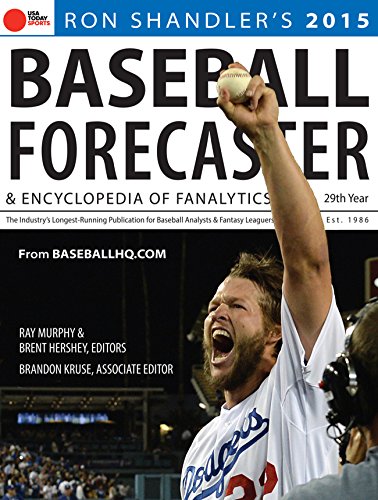
2015
Benchmarks
New: First round analysis, first pitch strikes, hard contact index, potential gainers and faders
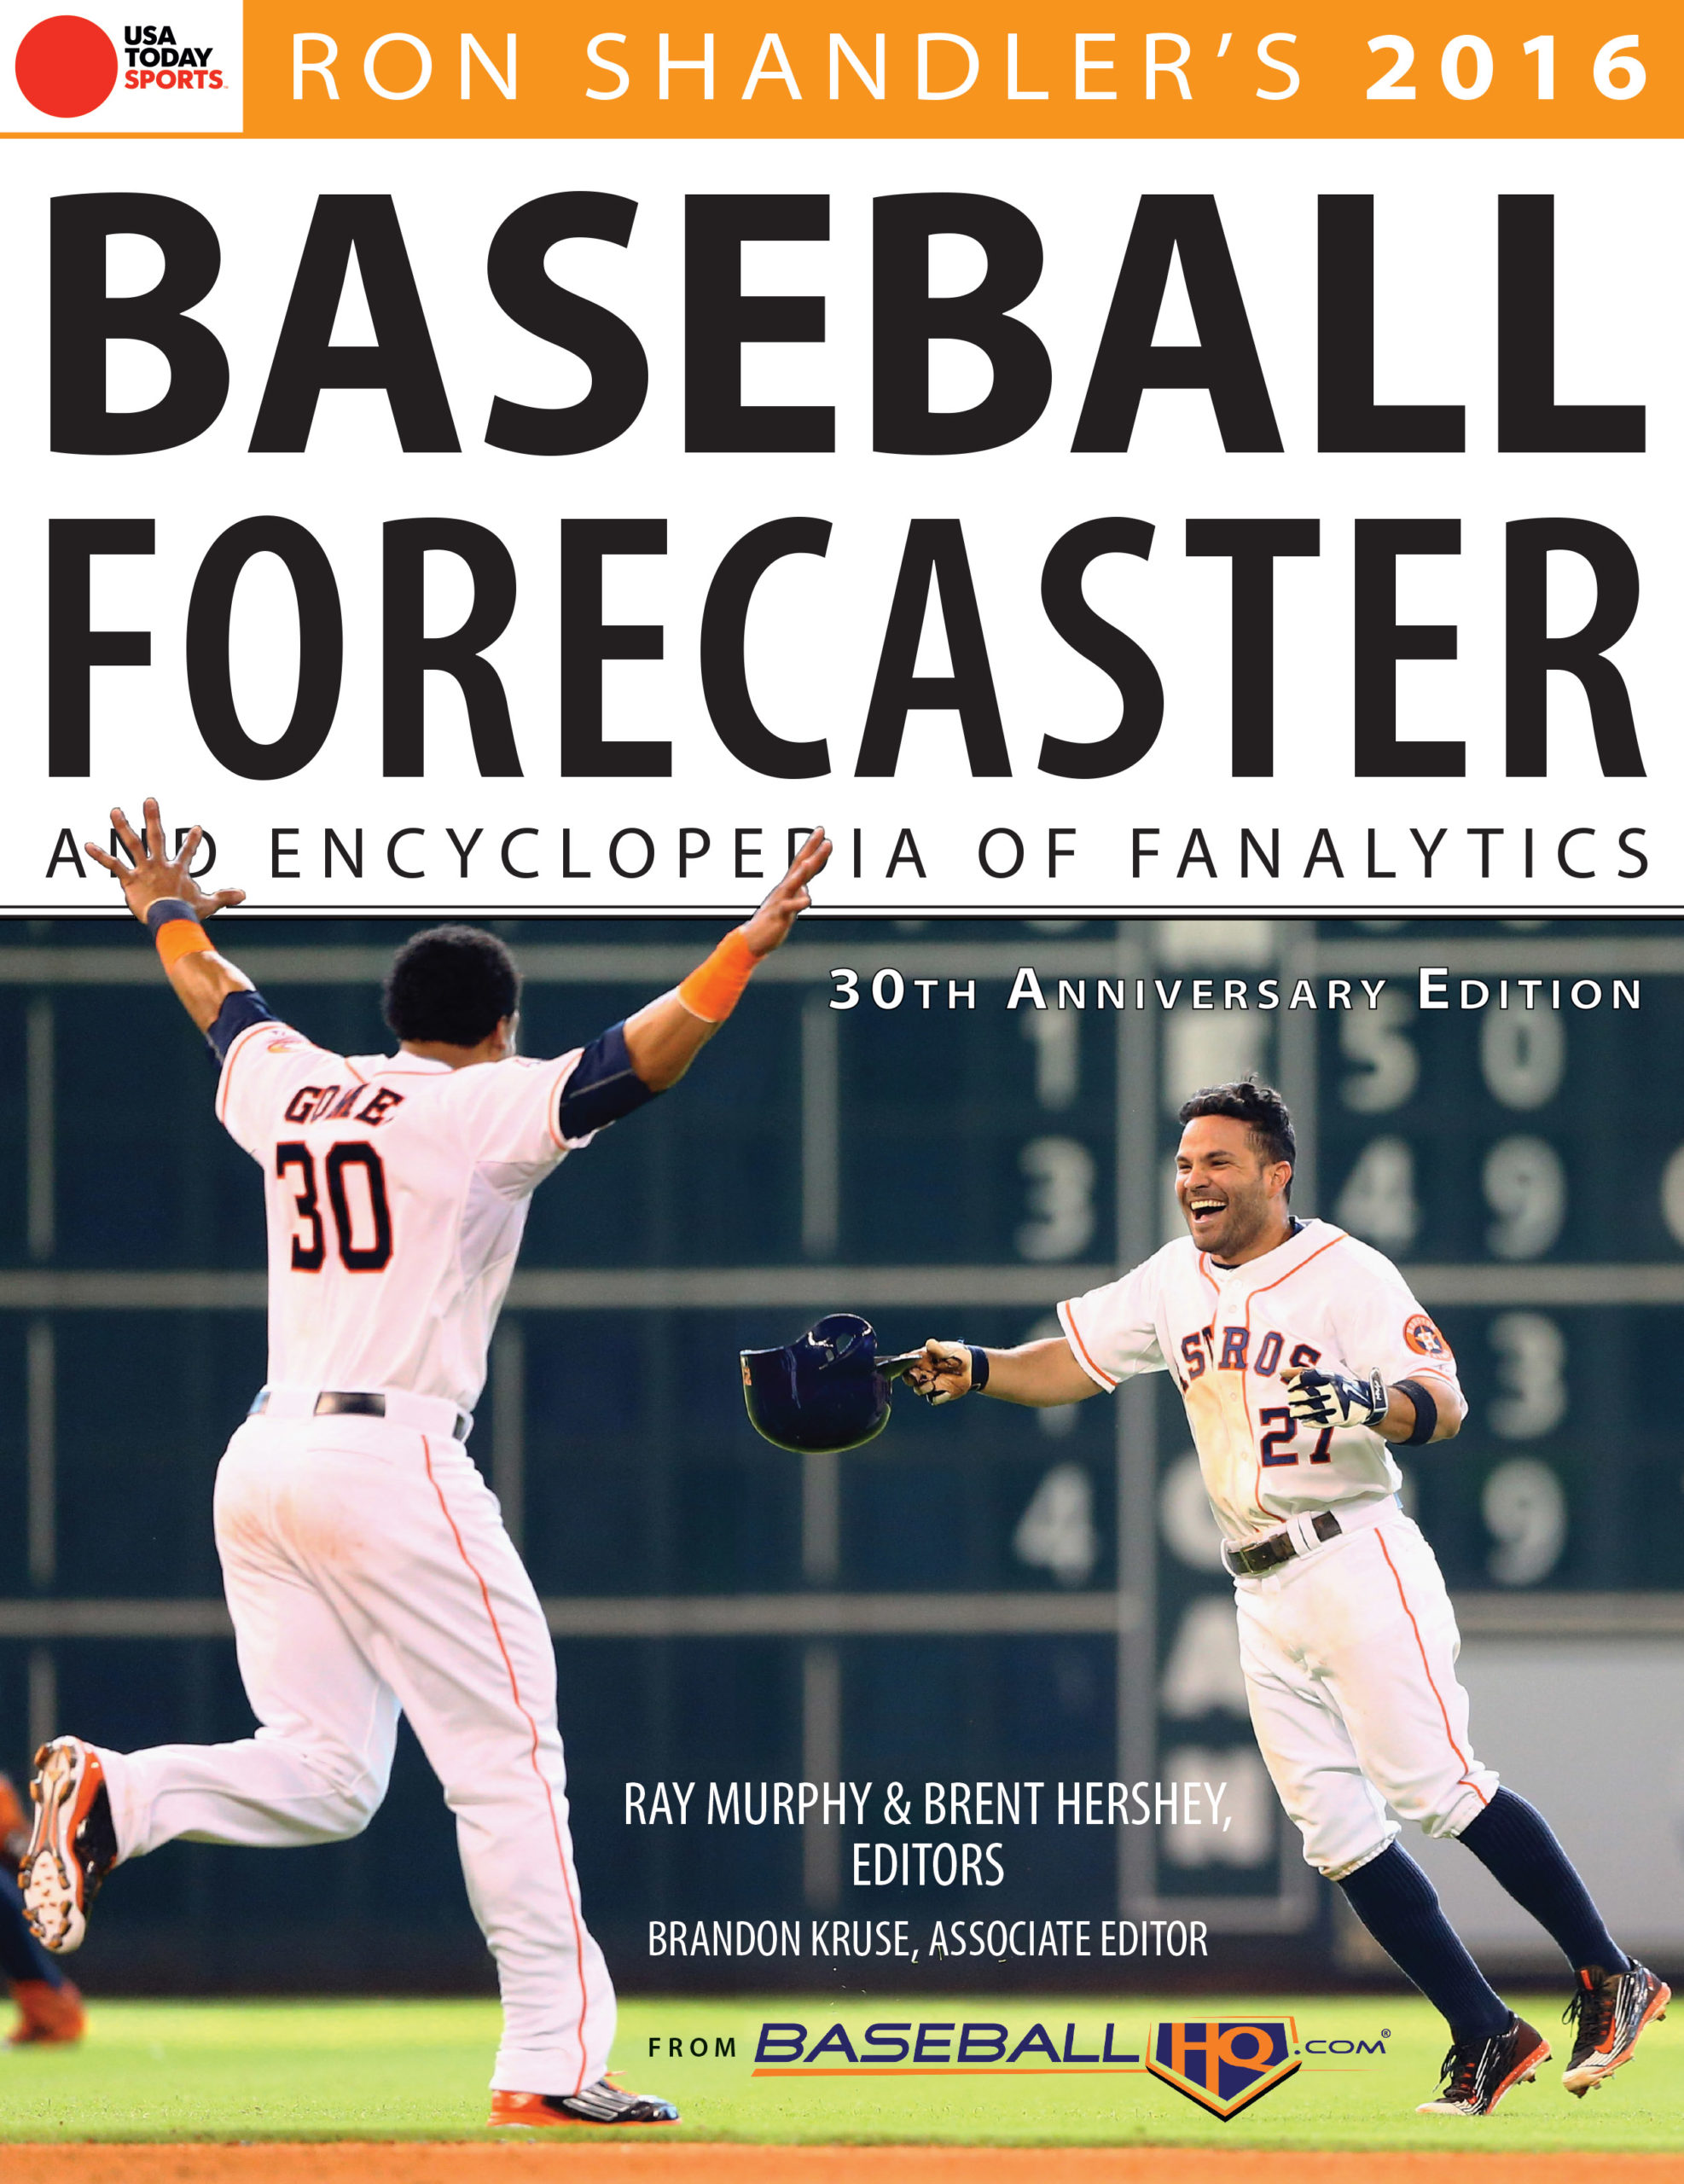
2016
Segue
New: Daily fantasy support. B-list players, international prospects section
2017
Devaluation
New: Updated PQS formula
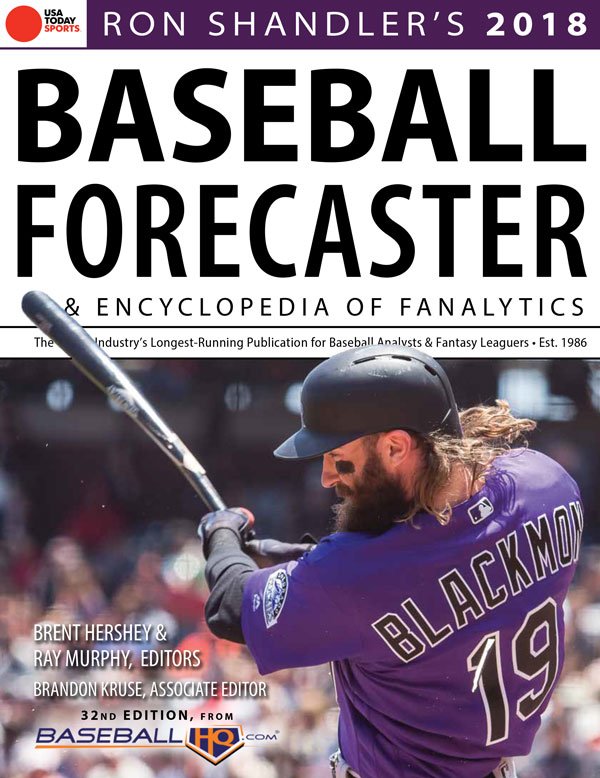
2018
Extremes
New: How to handle Shohei Ohtani, positive relative outcomes
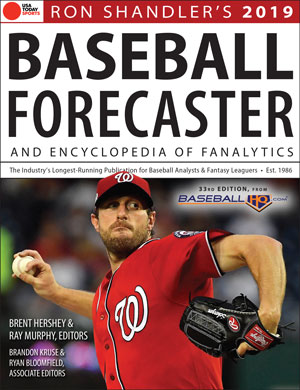
2019
Losing
New: Revised contexts in the changing MLB environment, fastball velocity
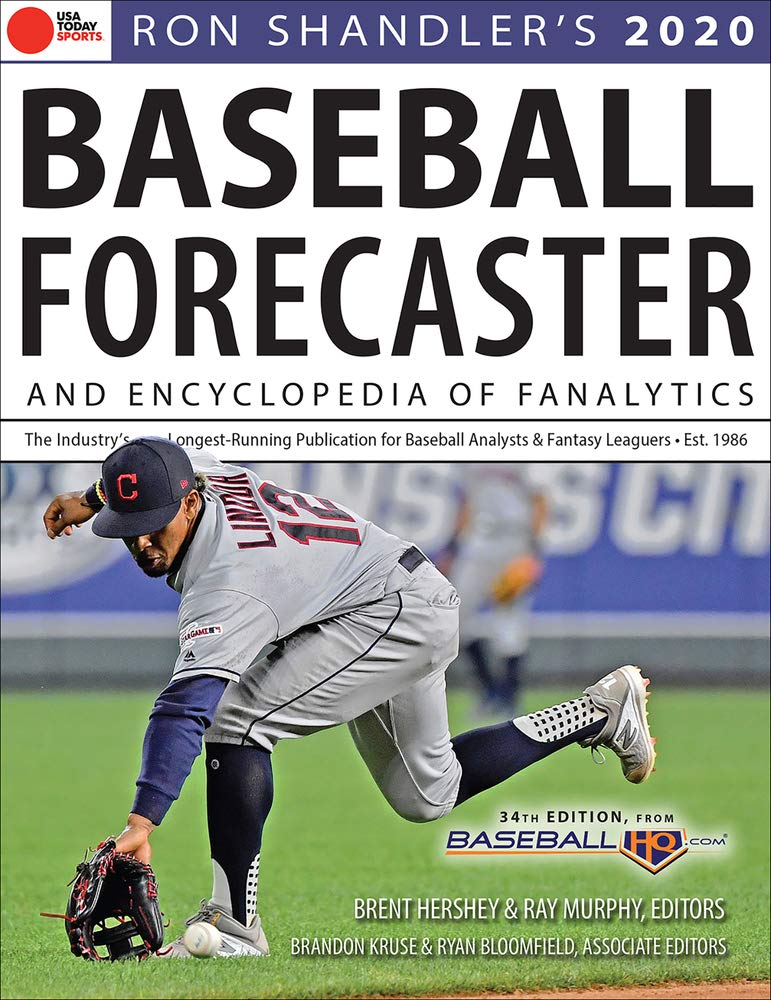
2020
Marketplaces
New: Plate appearances replaces AB, Platoon OPS+, xHR, xHR/F, xWHIP, Ball%
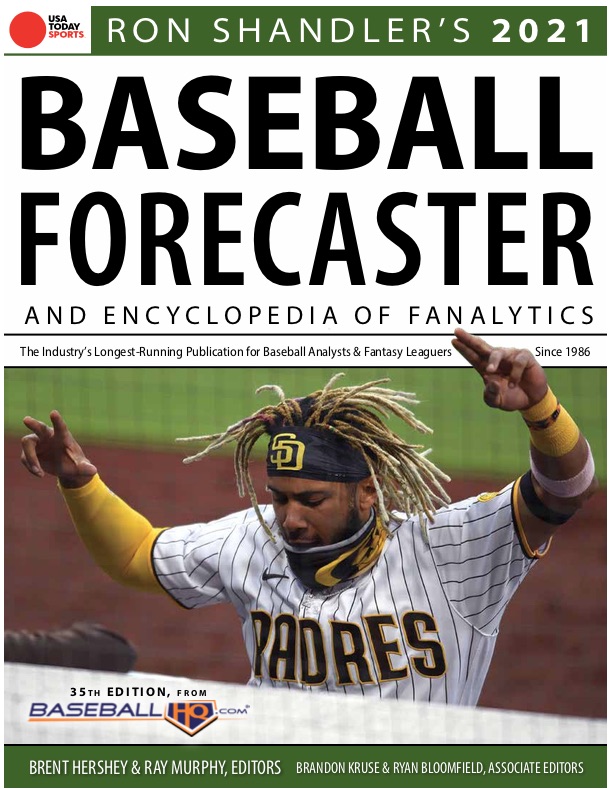
2021
Time
New: Percentage metrics (BB%, K%, etc.) replace /9 metrics (bb/9, k/9, etc.), QBaB, Barrel%, xSB
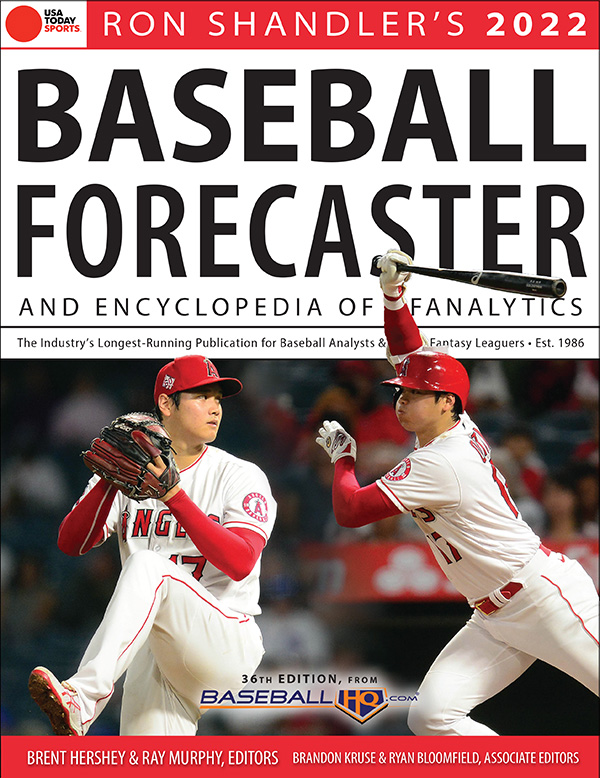
2022
Healing
New: xStats leaderboards, positional eligibility chart, head-to-head tools
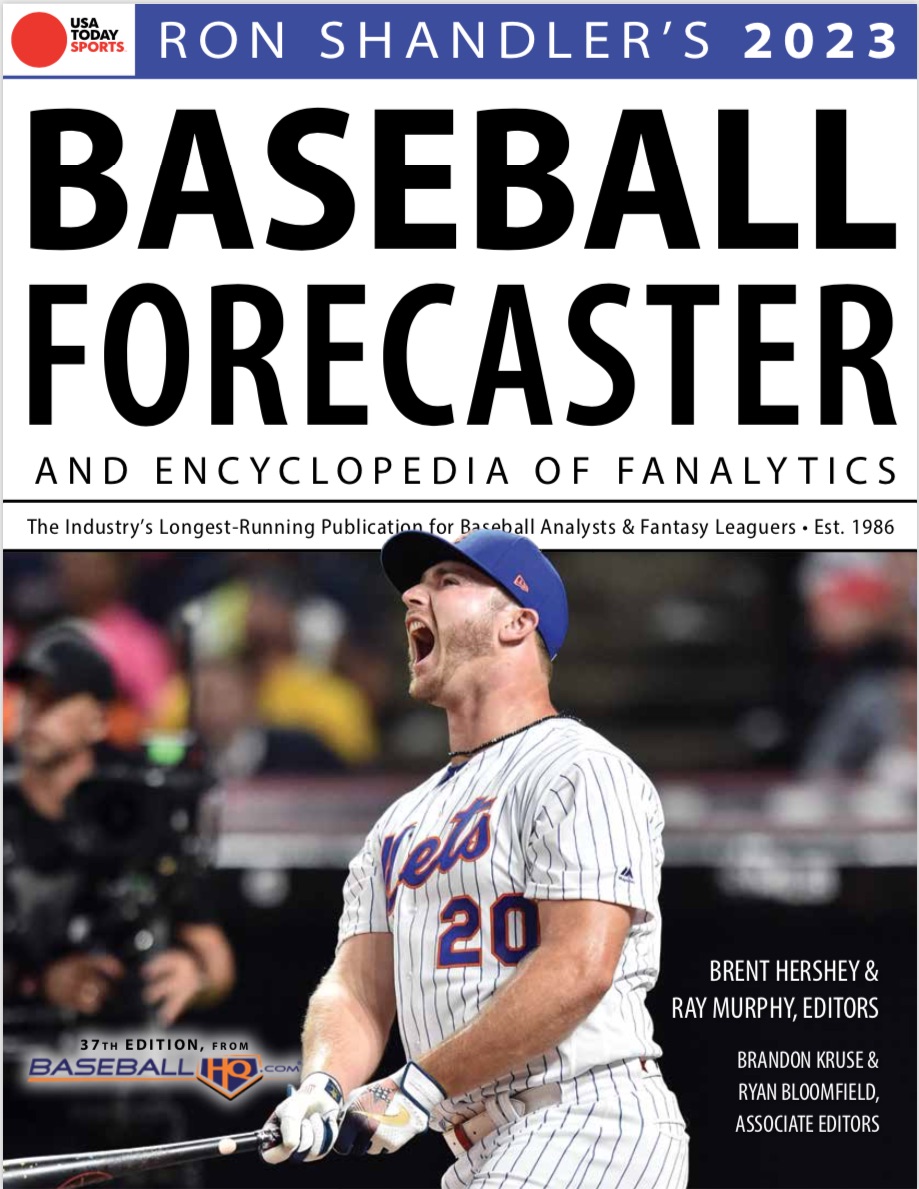
2023
Phoenix
New: Updated LIMA benchmarks, normalized xHR, playing time metrics
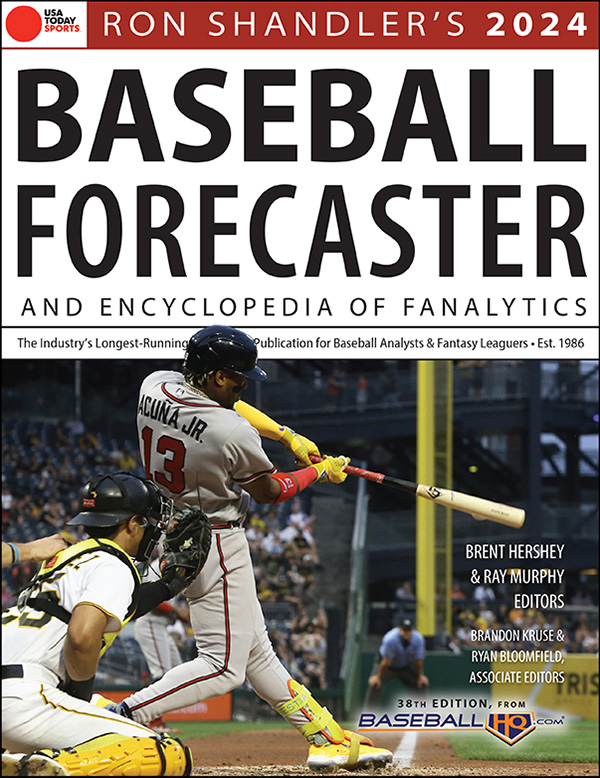
2024
One-Off
New: Adjustments made for MLB’s new rules (e.g. new xSB calc, etc.).
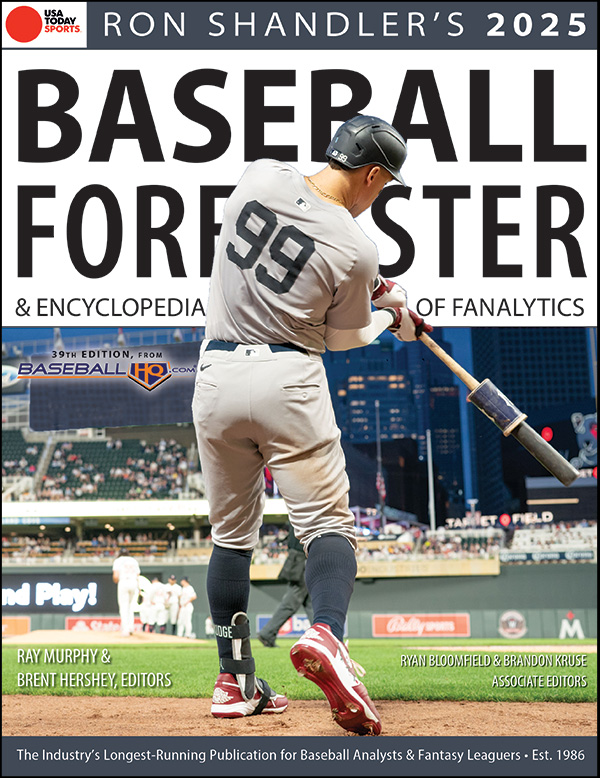
2025
Anchors
New: The Broad Assessment Balance Sheet (BABS) comes home.

2026
Narratives
40th Anniversary Edition
New: Advanced injury analysis

2027

